Sensitivity Study:
PIRCS-1(a) Period from Short and Long Simulations
Results are presented from simulations that overlap the
PIRCS-1(a) simulation period, 15 May 1988 through 15 July 1988.
Results for the 60-day period are extracted from the output of short (60-day) and long (multi-year)
simulations.
Initialization for the 60-day simulations is 00Z 15 May 1988 and for multi-year simulations
is 00Z 1 July 1986. Driving data for these simulations come from the NCEP/DOE AMIP-II
Reanalysis project. The simulations are labeld as follows.
- MMANL1: MM5-3.6.1 using Grell convective parameterization scheme; simulation
made at Argonne National Laboratory on a cluster of INTEL processors
- MMISU1: MM5-3.6.0 using Grell convective parameterization scheme; simulation
made at NCAR on a cluster of POWER 3 IBM processors
- MMISU2: MM5-3.6.0 using Kain-Fritsch convective parameterization scheme;
simulation made at NCAR on a cluster of POWER 3 IBM processors
- ECPCRS: Scripps RSM
The results are organized into tables such that results from short simulations
are presented in table row #1, and those from long simulations are
in table row #2. Column #1 contains results from MMANL1, whereas columns #2 and #3 show results
from MMISU1 and MMISU2, respectively. Simulations MMANL1 and MMISU1 have identical
model components but were the executables were compiled and run
on different computer architectures.
Some table cells may be empty. We will add these results
and others as we receive data.
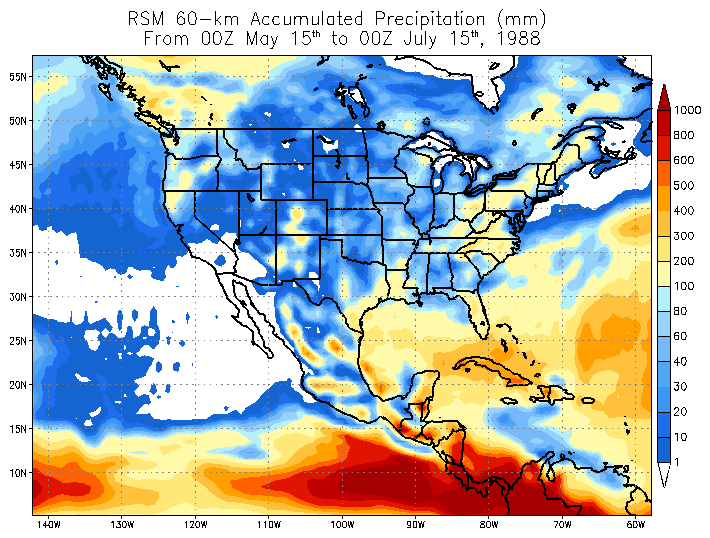
Table 1. Accumulated precipitation (the short simulations were integrated for 60 days; whereas I extracted 61-day periods from the long simulations).
- Although the shading differs slightly over the Midwest in MMANL1 and MMISU1, the values range
between 300 and 400 mm.
- Differences are larger between simluations using different convective
parameterization compared with those executed on different computer architectures.
|
|
MMANL1 Simulations
|
MMISU1 Simulations
|
MMISU2 Simulations
|
ECPCRS Simulations
|
|
Short Simulation
|
|
|
|
|
|
Long Simulation
|
|
|
|
|
Table 2. Time series of daily precipitation averaged over the central United States domain bounded
by 37-47N and 99-89W. Julian day 136 is May 15, 1988. Tick marks have a 2-day interval. Note
that I haven't been able to coerce NCL to produce a consistent Y-Axis scale.
- All Grell simulations contain two periods of multiday precipitation: Julian day 148-155 and Julian day 164-178.
- Kain-Fritsch simulations also have multiday precipitation during Julian day 148-155, but
after this period rainfall is intermittent.
- The Kain-Fritsch long simulation has higher daily rainfall rates than all other simulations during Julian days 148-155.
|
|
MMANL1 Simulations
|
MMISU1 Simulations
|
MMISU2 Simulations
|
ECPCRS Simulations
|
|
Short Simulation
|
|
|
|
|
|
Long Simulation
|
|
nbsp;
|
|
nbsp;
|
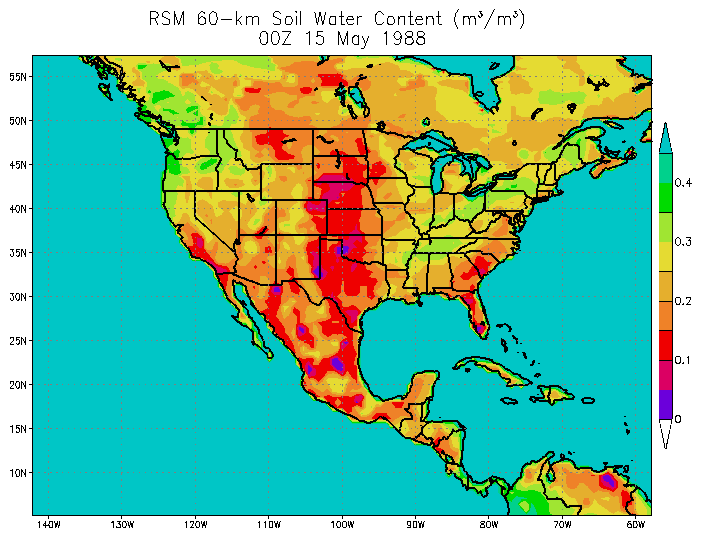
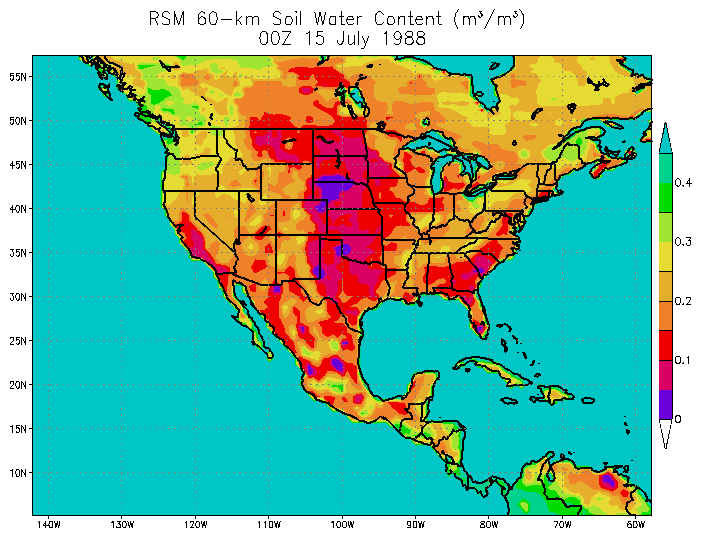
Table 3. Soil water volumetric content in upper 1 m of soil column.
- The initial soil water content is ~0.1 m3 m-3 larger over the Midwest
and Ohio Valley in the long compared to short simulations, creating a more intense gradient
of soil water content across the Plains.
- In the short simulations, the final soil moisture content in the Midwest and Ohio
Valley is less in the Kain-Fritsch simulation, even though precipitation over this region
is very similar to the Grell simulation.
|
|
MMANL1 Simulations
|
MMISU1 Simulations
|
MMISU2 Simulations
|
ECPCRS Simulations
|
Short Simulation
Initial
|
|

|

|
nbsp;
|
Short Duration
Final
|
|
|
|
nbsp;
|
Long Simulation
Initial
|
|
|
|
|
Long Simulation
Final
|
|
|

|
|